Tuesday, 28 June 2016

Re: {LONGTERMINVESTORS} Vivek Patil's Weekly Technical Analysis

many thanks

On Tue, Jun 28, 2016 at 7:54 AM, Rajesh Desai <stockdesai@gmail.com> wrote:
 

Weekly Technical Analysis
27 June 2016
- By Vivek Patil, India's foremost expert in Elliot Wave Analysis
 
Top Stories of the Week


  • Sensex volatile on Rexit & Brexit, settles 0.9% lower.

  • Govt approves easier FDI norms in Food, Aviation, Defence, Pharma & Retail.

  • Brexit triggers massive sell-off in Global stock markets, British PM to resign.

  • Rupee drops to 15-week low, Gold soars on Brexit.

  • Govt approves biggest auction of telecom airwaves to fetch Rs.5.44 lakh crores

  • Blame NPAs, not high rates for slow credit growth, says RBI Gov.

  • ISRO launches 20 satellites in one shot.

  • India fails to secure NSG birth.


Gains shaved off on Brexit, now watch follow-up to Friday's Hammer


[Technical readings carried forward from previous weeks are shown in italics. Readers can easily identify the new arguments which are written in regular font]

Last week we discussed, "after -ve Divergence, Index could correct for about 5 days. Index did end its correction in about 5 days, and attempted to recoverconsider last Wednesday's high at 26753 (Nifty 8213), as a crucial upside for the coming week … The 0-f line is still intact … 'faster' break below 0-f line would be 1st stage of confirmation that 'D' may be over. The 2nd stage or final confirmation would require faster retracement of the g-leg itself … In the fresh week, market would be discounting the effects of Rexit (Rajan's exit from RBI) and Brexit (Britain's exit from EU)it could be a challenging week ahead of us .. "

The week did prove challenging
as suspected. Breaking previous Wednesday's high on Monday, despite Rexit, Sensex initially moved higher. However, up 435 by Thursday, it turned around overnight as Britain voted for Brexit. Retracing all its gains of last weeks, it finally settled 228 pts or 0.9% lower, forming a High Wave candle for the week. Except Pharma, most sectors ended flat to -ve.


Index digested Rexit on Monday, recovered till Thursday, but tanked with a huge gap-down on Friday on unexpected Brexit vote.

Technically, the rally from Double Bottom of 13th & 14th Jun remained "slow" and "measured". As compared to preceding fall from 8th Jun, the rally had consumed 250% time to retrace only 95% of the fall.

Also, as can be seen on the Daily chart, after rallying till Thursday, Index had reached "overbought" zone. The slow progress along with overbought oscillator proved fatal on Friday.

After closing near day's high on Thursday, action opened with a huge gap-down on Brexit. Friday's candle looked interesting however. It formed as a Hammer with a long Lower Shadow at its bottom. 

The lower shadow comprised of support in the 2nd half, which was caused by FTSE itself recovering after its initial gap-down dip. Down 8.7% initially, it recovered to prune down its net loss to just 3.1% by close.

Friday's late support was also on a/c of some technical reasons. As marked on the Daily chart, Index bounced from levels closer to the 200-day and 61.8% retracement level to the height of g-leg and gap-up area of 26th May

Sensex also respected the
Grey channel shown on the Daily chart. All in all, for the fresh week, we may consider Friday's low of 25911 (Nifty 7927) as an extremely crucial level on the downside.

However, to confirm Friday recovery was meaningful, we need to see follow-up strength and close above the head of the Hammer at 26436 (Nifty 8101). Such an action could turn the bias +ve for an attempt to cover the gap-down area above Friday's candle.

Technically, +ve follow-up to Friday's Hammer would also suggest support taken at the crucial 200-day EMA. On the other hand, absence of such +ve follow-up could be -ve for re-testing Friday's bouncing point.


Remember, Index retraced the 8-day rally from 13th Jun to 23rd Jun in a single day, with a gap-down action on Friday. This amounts to faster retracement of the rally.

By NEoWave, Faster retracement of rally raises question if "D" is over. The 1st stage of confirmation is generated by way of break of the 0-f line. The 2nd and final stage of confirmation required faster retracement of the g-leg itself.

If we have only 1st stage confirmation, and market avoids generating the 2nd stage, it would indicate that the fall on Brexit was only an x-wave, and that "D" would continue to form, but this time as a "Complex Corrective" involving an x-wave
.

As long as Index avoids -ve follow-up below Friday's Hammer, we cannot rule out this as a possibility, and the x-wave has been marked on the chart with a Question Mark

Remember, on Thursday Index closed at the highest level, but opened with a huge gap-down on Friday, putting all bullish bets in jeopardy. Question is whether Bulls would attempt sustaining above Friday in order to cut their losses

This is a trading possibility, which confirms if action sustains above Friday's Hammer. In such a case, watch Friday's gap-down area, which is a technical resistance. We need strength above this gap-down area to confirm that Brexit action was an x-wave, and upwards to sideways 2nd Corrective has indeed opened, which can hit a fresh high for "D".

All in all, watch follow-up action beyond Friday's Hammer candle which could guide the action during the fresh week. Keep watching FTSE as well.

________________________________________________________________________________


Remember, after every 5-10% rally, Index has been seen trading in such a flat & volatile mode. As we said, "9 higher highs in a row is the record, so far, during the year '2016". We, accordingly, turned cautious after 8 consecutive higher highs were already made inside g-leg

Structurally we argued that g-leg could be similar to the 1st rally we marked as a-leg of the Diametric. Compared to the a-leg, current g-leg rally achieved 80% magnitude in 150% time.

This makes current rally or g-leg "slower" compared to the a-leg. We may call this Diametric also as a "Diamond Zigzag", because it looks Zigzag-like a-b-c pattern with a "Diamond-Shaped" bulge in its corrective middle part.

However, the huge time consumption in the middle part forces us to subdivide it into a number of legs, i.e. b-c-d-e-f.

As per NEoWave, b-leg of a Zigzag should consume "more" time compared to a-leg. However, its time-ratio cannot be more than 3 times. Against 5 days in a-leg, the corrective phase consumed 50 days, forcing us to sub-divide it.

As per Dow Theory, an up-trend is defined by the "higher top higher bottom" formation. 

Remember, the bottoms of b, d, f legs were all higher, and the tops of a, c, e, g legs were also higher. Under the circumstances, bulls may not give up so easily. On oscillator, we'll see if higher high generates any -ve divergence.

Also, Sensex has now made 8 consecutive higher high till Friday, and 9 higher highs in a row has been the maximum number during '2016 so far. This raises question if the up-move is now overstretched.

As per Dow Theory, trend is assumed as UP as long as the action maintains "higher top higher bottom". This remains the most profitable trend identifier technique in the entire history of Technical Analysis.

S
ensex "overlapped" with the bottom of Jun'15. It also broke the line joining the highs of Mar'15 and Jul'15, decisively. This favors Expanding Triangle (ET) pattern for the downward phase from Mar'15 onwards.


As per NEoWave, the "overlap" of "D" with "A" is a necessary symptom of an ET. An ET is a 5-legged pattern with magnitude of its legs "expanding" in both directions. Post-Budget rally is, accordingly, considered as the "D" of our ET.

O
n directional side, "C" leg of ET was exactly 161.8% of "A". On non-directional side, the current "D" leg is now 180% compared to "B". Time-wise, "C" was twice of "A", and "D" is 123% of "B".

So far, the ET appears as a "Running" type, because A-C as well as B-D lines both look downward sloping

We not only require faster retracement of last rising segment, but also a lower top lower bottom formation thereafter, or whenever it shows, to confirm completion of the pattern and open its -ve implications.

By our alternate Expanding Triangle (ET) assumption for the rally, the post-Budget rally is considered as "D" of ET. The "D" leg is already "bigger" than "B" leg price-wise as well as time-wise.

If Index does drop below 25140 (Nifty 7728), and later also weaken below the bottoms of b-leg and d-leg, at 24523-354 (Nifty 7516-7405), then we'll be forced to assume that post-Budget rally is over. 

M
ost investors missed buying at Sensex 22500, and the first leg of rally (a-leg) was too quick for them. Above 200-day EMA, they were sucked into buying. 

This usually happens due to "Theory of Contrary Opinion", a simple concept that states that when majority of investors, especially the ones who failed to pick the bottom, expect market to go up, it will actually go down. 

Generally speaking, the Theory is based on the idea that majority is usually wrong. We are not suggesting that one could always go contrary to the majority opinion, but one should certainly consider that alternative.

From the perspective of Technical Analysis, market sentiment usually proves an invaluable tool, especially when it goes against what technical position suggests.

Structurally, we considered the 13-month long corrective phase as a channeled Triple Combination. Now, however, we are describing the same as Expanding Triangle (ET), as marked on the following chart :


The post-Budget rally is labeled as the "D" leg of ET.

The Corrective phase from last year high of Mar'15 is now into 13th month.


Also observe the 2-year cycle of tops and bottoms on the Monthly chart of Sensex shown below. Since 1980's, this cycle shows Index turning every alternate 'March.


These two time parameters does not rule out Index eventually opening a downward "c" of Triangle in the 3rd Corrective OR "E" of Expanding Triangle, and test the recent bottom at our last year target level of Sensex 22500.

As can be seen on the chart below, most of the recent bottoms were confirmed with a higher bottom formation, which, however, retraced the initial rally from the bottom by about 60-80%.

Just before a big rally, remember, Index usually absorbs all the negativity at such a higher bottom.


The "E" of ET can fail. But if it does not, then "E" wave can open disastrous downsides, as much as 161.8% to 261.8% of the "A" leg.

An ET is a 5-legged formation, consisting both falling as well as rising legs showing "Expansion". As can be checked on the chart, "C" was exactly 161.8% of "A" "externally", and 100% "internally". Similarly, "D" has now turned "bigger" than "B" leg price-wise as well as time-wise.

If the ET formation does confirm, then "E" (if it is not a Failure), can be "bigger" than "C" leg.

We observed that Sensex was respecting all technical resistances one after the other. Post-Budget, it rallied from our last year's downside target of 22500 up to 25K level, which was the top of our 2nd x-wave. This was our initial target. Index paused there for about 2 weeks.


If the initial rally was a-leg, then the pause at 25K was marked as b-leg. Index rallied again as c-leg. Above 25K, we had targeted the gap-down area of 7th Jan'16 (at about 25400-500) as our 1st upside target and 200-day EMA as the 2nd target.

Index paused at 25400-500 levels, again for 2 weeks
. Indeed, the topping formation looked like a "Double Top". 

The 25500 was the value of the lower line of the Yearly Trajectory we showed on the following Yearly Log-scale chart of Sensex.


This line joins the lows of '2012 and '2013 on Yearly log-scale chart. The line, remember, provided support during '2014.

The line was broken during '2016, and as a result, current up-move could be looked upon only as a "pull-back" to the broken line. Turning lower from the line could, accordingly, have long-term -ve implications.

Overall, we mentioned that the levels of 21300-22500 are crucial on downside because it was the NEoWave "pattern implication" of 60%-70% retracement to the 19-month Triple Combination rally from Aug'13 to Mar'15, as was shown on the following chart. Index did respect the pattern implication and rallied 13%.


Time-wise, we argued that the current month of Apr'16 is crucial because it's the 13th month of corrective phase.

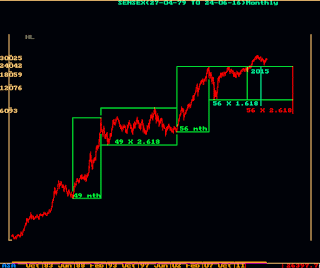
It was argued that all corrective phases so far on Sensex continued for a number of months closer to a Fibonacci Number. This observation is shown on the following chart :


This would also mean, if the correction that started last year does not get over in about 13 months, then it can get stretched to 21 months.

This, however, would also require the change in the structure we assumed for the 13-month log corrective phase. We assumed it to be a channeled "Triple" with 3 correctives separated by 2 x-waves.

However, if the Correction does not get over around Apr'16, and starts stretching beyond, it could be converting itself into a big NEoWave "Expanding Triangle". 


Prior to Budget, Sensex broke the "Political 0-point" and panicked to test 22600. It, then recovered back to the "0-point", but the level provided resistance on 22-23 Feb. Panicking once again, Index dropped to 22500 on the Budget Day.

The lows of 22500-600 look like a Double Bottom. Under Technical Analysis, "Double Bottom" can prove as a reversal pattern. Its height of 1300 points cane be added to the "0-point" to project 25100-200 as an upside target based on the Double Bottom pattern.

This projection matches with VP Grid level at 25150
, as had shown on the following chart, and therefore appears crucial from the Grid perspective as well.
Last week, Index hesitated near the Grid level  :


The strong bounce came exactly from our last year's target of 22500. This level was imprinted on the mind of the players, and they played it.

This level, remember, was 60% pattern implication for the 19-month long Triple Combination rally from 17449 (Aug'13) to 30025 (Mar'15). The 60% calculated to 22479, and Sensex bounced from 22495. We printed 22500.

However, Index could now be under the influence 8-year cycle of losing 50-60%, and has broken its yearly trajectory since '2012 (refer to relevant chart shown elsewhere in this report).

Under the circumstances, failure to base out, holding 21300-22500 (Nifty 6350-6750), i.e. the 60-70% pattern implication area, could result in an Oct'08 like situation. Budget needs to create a dramatic +ve sentiment to avoid such an eventuality, else …

Over a year ago, we showed performance of Sensex post elections on the chart given below. As shown on the chart, Sensex' performance always remained subdued after non-Congress Govt gets elected.


As we argued, anytime the Sensex dips below 25K during '2016, it would break its Yearly Trajectory. Break of the trajectory could have implications for the coming year. Structurally, it would raise the possibility of the current corrective phase from Mar'15 stretching to 13 months till Apr'16.

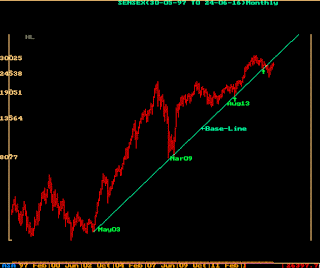
Remember, Sensex was also testing the crucial Monthly Base line we showed on the following chart, and the same has been broken.


Prior to '2013, there were two major corrective phases, first during Jan'08 to Mar'09 and second Nov'10 to Dec'11, and both lasted for 13 months, another Fibonacci Number. 

Based on these historical numbers for major corrective phases time-wise, it is possible that if the current phase stretches beyond Nov'15, i.e. 8 months, then it can extend to Apr'16, i.e. continue for 13 months.


In the previous 13-month long Complex Corrective phase during Nov'10 to Dec'11, we have seen the 0-X line working as a resistance, as can be checked on the chart above.

Indeed, we compared the current post Mar'15 fall with this 13-month fall as both are channeled Complex Correctives involving x-wave. As can be seen on the chart above, even after crossing the 0-X line after Dec'11, Index came down (by 80% of rally) for the higher bottom. We, accordingly, consider 0-X line as crucial.

In terms of 2-year cycle, we argued both Sensex and Nifty could lose about 25% from its top valuation. Shaving off 25% from their respective high of 30015 / 9119, projected about 22500 / 6800
. However, to achieve these projections, both Indexes need to weaken below their Base-Lines.


In Dollar terms, Sensex was already below the lows of 16th May'14 six months ago, as can be seen on the following Dollex-30 chart. This Index is 38% lower than its peak during '2008, and 30% lower than its highs of Mar'15.

The Dollex-30 chart also shows Head & Shoulder formation since May'14, the Neckline of which was broken with a gap-down action.


The FII Net Investment figures turned -ve since 22nd Apr'15 of this year. FIIs sold Rs. 30300
crs. worth of stocks since that date, pulling the Sensex down 18% so far in this year.

Last time FIIs sold out was during Oct'07 to Mar'09, when the Index shaved off as much as 63%. FIIs invested Rs.612000 crs after Mar'09, but Dollex-30 showed un-impressive gains during this period, as it is still below its '2008 highs.


Ever since the new Govt got elected, the Dollar-Rupee equation as gone against FIIs who invest in Indian equity in Dollar terms. The Dollar has appreciated nearly 15% from Rs. 58.27 in May'14 to Rs. 66.92 recently.

Falling stock prices along with appreciating Dollar presents a double-edged risk scenario for the FIIs
, and their exit from Indian market is a natural result of that.


The question is whether this could cause a '2008-09 like scenario, and if the 8-year cycle, due in '2016, has arrived a year earlier.


Late last year, we expected market to hit a major top during January of this year, based on "January-Topping cycle".

As we showed on the following chart, except during '2006, all the major and minor tops on Sensex occurred in the first quarter of every Calendar Year, for 15 years since '2000.


We also pointed out that market has seen major corrections or profit-booking modes every 2 years ever since '2004. 

Except during '2013, when Sensex corrected only 13%, all other corrections saw cuts of either 25-35% (like during '2004, '2006 and '2010) or 50-60% (like during '2008)
.

The last major profit-booking was during '2013, and in '2015, 2-year cycle of profit-booking was due.

So far, in this year, the Sensex has corrected
25%
from 30025 (Nifty 9119) to 25119 (7626). The damages in individual stocks and sectors are selectively much larger.


The Index broke below its 200-day EMA with a gap-down action, and it is currently trading below it, as can be seen on the following chart :


We have been cautioning investors since the beginning of '2015 also because Index had achieved breakout implication of 5-year Ascending Triangle from '2008 to '2013, we showed on the following chart.

The largest leg of the Ascending Triangle was the fall of '2008-09, i.e. about 13000 Sensex points
. As per NEoWave, the normal thrust implication out of a Triangle is 100% of the largest leg of the Triangle.


From Aug'13, when the Ascending Triangle got over, Sensex has moved up almost exactly 13000 pts from 17449 to 30025 :


The Sensex top at 30K levels was exactly the Grid level as per VP's Grid Levels System (GLS), which we have been using since last 5 years. 


It was also pointed out that Index looked "overstretched" after rallying for 12 quarters, which was a situation similar to major top of '2008.


Based on Nifty PE Ratio, we warned that market appears to be near "Bubble Territory", as was shown on the following chart :


The 22500 level is also close to previous major tops of '2008 & '2010, and is also the lowest level of "Sensex Trajectory" we showed since beginning of this year. It is also value of the line joining '2003 & '2009 bottoms on Yearly chart of Sensex :


The likely Sensex trajectory for the year '2015 could be provided by the channel shown on the Yearly chart above.

As we saw previously during '1988 to '1994, and again from '2003 to '2007, Sensex' bull phase trajectory is usually contained in 2 parallel lines roughly. Sensex, in the past, maintained its trajectory for 5 years or 7 years, before breaking it.

The current trajectory began from '2012, and '2015 would be 4th year in this trajectory, which could break either during '2017 or '2019, if the past is any indication.

F
or the year '2015, the trajectory projects 32800 on the upside and 22800 on the downside.


For '2016, however, the lower line is at 25500 as marked.

The current trajectory is at a lower angle (about 30 degrees), as compared to previous 2 trajectories of 1988-94 and 2003-2007. The angle of ascent for both was identical at 60 degrees. The lower angle of current trajectory has been despite heavy FII Inflows and political change.


Technical readings carried forward from previous weeks

Since Aug'13 till Jan'15, the biggest fall was seen on the day of Election Results, about 1503 pts. 

Post
Dec'14, however, bigger drops are happening.


The disparity between Sensex and broader market was shown on the comparative chart below.

The broader market outperformed Sensex from Nov'13 onwards, and its out-performance was especially significant from 16th May onwards, the day of Election Results, as can be seen on the chart.


In the meanwhile, investors may keep a tab on the risk factors. Major event like Election Results, Budget, are now behind us. Hope rally has played out. FIIs selling off is a risk factor, though, So far, this has not yet played out on any meaningful scale.

Another set of risk factor would be Global, like Dow breaking its base-line on its monthly chart, etc. 

On one higher degree, we considered post-Aug'13 development to be F leg of a larger Diametric formation from '2008 onwards as shown on the chart below.


This long-term scenario marking the larger Diametric was published on 6th Feb'12. This Diametric assumption, as was argued, compared well with the 11-year Diametric formation previously seen during '1992 to '2003.

As shown on the chart above, F is the "Expanding" leg of the 7-legged Diametric from '2008. In the previous instance of the Diametric during '1992-'2003 period, F leg had hit new highs during '2000.


In other words, F leg of the diametric making new highs is nothing new. After hitting new highs during '2000, G leg went down till '2003.

We argued for a Diametric development from '2008 onwards because we observed time-similarity within its legs, which is symptomatic of such a pattern. So far, most of the legs, except B and D, have consumed exactly about 13 months.

On the monthly Close-only chart given below, one can see Sensex crossing previous highs, indeed taking their support for reaching further newer highs for the F leg
:


We may watch if Sensex shows maturity signs at current levels and starts cracking.

We considered this alternate scenario when Sensex moved above 2008-10 highs. It shows corrective phase from '2008 completing as a 5-legged Ascending Triangle. This scenario can open much higher targets, 30000+ for Sensex.


The 30000+ target is nothing but 100% (+/- 25%) breakout implication of the largest leg of the Triangle.

A
ccording to NEoWave, corrective phase should consume more time than the move it is correcting. After the 56-month rally from May'2003 to Jan'2008, Sensex has corrected for 67 month from Jan'2008 to Aug-13, i.e. a larger period as required under NEoWave. 


The following picture should throw some light on the post-election movement on the Sensex since '1980 onwards :


Since '1980, major up-moves were seen mainly after formation of a Congress-led government.

Now that a BJP-led Government is taking over, and has a clear mandate for development and governance, we'll watch if a new era is taking over, wherein previous historical political parameters will get challenged.


By NEoWave logics, complete and faster retracement of the last upward leg, would confirm that the Diametric structure inside the 2nd corrective is over. Look how faster retracement of the 6th rally on the chart above signaled completion of the 1st corrective.

We, however, cannot rule out that a sufficient time-correction is required after any multi-fold rally. As shown below, such time correction can last for as much as 161.8% to 261.8% time ratio to the multi-fold rally.


As for the last multi-fold rally during '1988 to '1992, its correction lasted for 262.8% time ratio, from '1992 to '2003.


We argued in favor of long term consolidation phase beginning '2008 because prior to '2008, Sensex had multiplied 7 times from its '2003 lows. We argued, such multi-fold rally could results into a multi-year consolidation phase. Inside such a phase, even moves reaching new highs are considered its internal part, and not as breakouts.

As we noted, after 11-fold rally during '1988 to '1992, Sensex consolidated for 11 years till '2003 (261.8% time ratio). Within this consolidation, Sensex corrected as much as 30-60% every time it came closer to previous highs or even after hitting new highs

A
n ideal "suckers rally" usually involves making a New High. As we can be seen on the chart below, Sensex moved higher than its '1992 highs during '1994 and '1997, but reacted by over 30% both the times.


Later during '2000, it broke 1992/1994/1997 highs, by as much as 1500-1600, only to lose 58% later. After a severe corrective phase lasting from '2000 to '2003, Index broke '2000 high during '2004 by 100 pts, but even then shaved off 30% before the next rally could take place.

All this happened because the 11-year long '1992-2003 phase was a multi-year corrective phase correcting the preceding 11-fold rally from '1988 to '1992.


On the super-cycle degree, we are considering a "Terminal" development since '2003 onwards. The Terminal was suspected because its 1st wave from 2003-2008 was a label-3 "corrective" pattern. (As against a normal label-5 Impulse pattern).

The 2003-2008 rally was internally marked as a corrective pattern called a Running Diametric


Also, more importantly, it is only inside a Terminal that 2nd wave can be Triangle. (as against this, in a normal Impulse, 2nd wave cannot develop as a Triangle, only 4th can).


Under the circumstances, if our assumed F leg continues beyond 13 months, i.e. beyond Jul-Aug of this year, then we could be forced to consider the current up-move as the 3rd of the Terminal Impulse, as per the Green labels shown above.

The basic NEoWave requirement is that such a corrective phase should consume more time than the move it is correcting. The '1992-2003 corrective phase, remember, continued for a time-ratio of 261.8% to the preceding 4-year rally from '1988 to '1992.

As per Wave Theory, a corrective phase shapes up as 3-legged Flat/Zigzag, 5-legged Triangle or 7-legged Diametric (which basically combines 2 Triangles).

T
he question, therefore, is whether the corrective phase ended as a 5-legged Triangle in Aug'13, OR it would continue for 2 more legs and form as 7-legged Diametric.

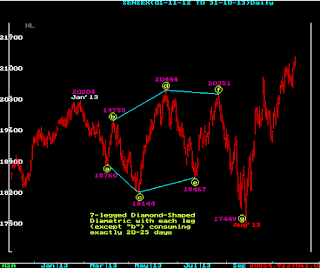
As was shown on the chart below, all the up-down legs from Jan'13 to Aug'13, except "b", consumed exactly 20-25 days, and formed into a 7-legged Diametric (Diamond-Shaped variety).


As per VP's observational rules, all the legs, except "b", of a 7-legged Diametric tend towards time-similarity. Indeed, by reverse logic, when legs begin to be similar in time, the structure is more likely to form as a Diametric.

S
imilar to the pattern explained above, on one higher degree, we also observed time-similarity from '2008. All the legs, except "b", consumed about 13 months since the year '2008.


The question, now, remains if we continue with the Diametric assumption or complete the post-'2008 development as a 5-legged Triangle. As we have been explaining, we can open possibility of ending the phase as Triangle only if we see strength continuing beyond Jul-Aug of this year.

T
he market is being moved mainly on a/c of FII buying heavyweights selectively, even as many stocks have been trading near previous lows in the broader market.

During 8 quarters from Oct'08 to Nov'10, FIIs invested over Rs. 215000 crs as per SEBI data. In the current 8-quarter up-move post Dec'11, FIIs invested over Rs.242000 crs. Thus, post Dec'11 up-move has so far remained smaller despite the larger investment from FIIs.

As for DIIs, SEBI data shows divestment of Rs. 32400 crs during Oct'08-Nov'10, and of Rs. 43800 crs after Dec'11. Thus, the up-move of last 8 quarters remained smaller despite the higher FII investment, and larger divestment from DIIs.

Despite huge FII buying in the last five years since '2008, the Sensex was still closer to '2008 high so far, despite Net Investment of Rs. 369901 crs till Jun'13 by the FIIs.

H
ow reliable is the FII Net Investment data coming from SEBI is another question. We generally see the inflated figure in FII buying matching with DII's selling figure. However, above observation is made assuming the data from SEBI is correct.

Not related to Wave Labels so much on an immediate basis, VP's 30% Principle shows that Sensex is at a risk of 25-30% cut every 2-3 years, ever since '2004, i.e. in the last 9-10 years.


In this period, the 25-30% cut was seen from the tops in May'2004, May'2006, Jan'2008 and Nov'10 so far. The last bottom was during Dec'11. Sensex has now completed 27 months since then without a 25-30% cut.

We should keep the 30% principle in the back of the mind, and act as required when the time comes.


Appendix : Super-Cycle-degree Wave-scenarios for Sensex

For Super-Cycle-Degree wave-scenario, consider following ASA Long-Term Index. This Index has been created by combining a very old Index compiled by a British advisor (from '1938 to '1945), with RBI Index ('1945 to '1969), F.E Index ('1969 to '1980) and Sensex (thereafter till date).


The wave-count presented shows that the market is into the lower-degree 5th of the SC-degree 3rd or 5th wave.

The detailed wave-count from '1984 onwards can be seen on the Monthly chart given below. The 2-4 line shown on the ASA long-term Chart above, and Monthly chart below, would determine if the post '1984 Impulse is a Super-cycle-degree 3rd or 5th.


Super-Cycle-Degree 3rd (or 5th) began since Nov'84. Its internal 3rd was an "extended" leg, which achieved exactly 261.8% ratio to the 1st on log scale. The Sensex is now forming the 5th Wave, and the same could develop as a "Terminal", because its lower-degree 1st wave from May'03 onwards developed as a Diametric (which is a "corrective" structure, rather than an "impulse"). Within the non-directional legs, 2nd was exactly 61.8% of 1st value-wise, and 161.8% time-wise. The 4th was 38.2% of 3rd value-wise, and 261.8% time-wise.

While the 4th is shown as a 3-legged a-b-c Flat on the monthly chart above. Alternatively, the 4th is shown as a 7-legged a-b-c-d-e-f-g Bow-Tie Diametric on the Monthly chart below. The chart below also shows 11-year parallel channel from Apr'1992 to May'2003. As shown, if one projects the width of this channel on upper side, such a projection gave 20000 as the "minimum" target. This forecast was achieved.


As mentioned above, the lower-degree 1st from May'2003 to Jan'2008 appears to be a Bow-Tie Diametric, marked as a-b-c-d-e-f-g. It is called "Diametric" because it combines two Triangular patterns, one initially "Contracting" up to the "d" leg, followed by an "Expanding" one. The contraction point is the "d" leg, and the legs on either sides of it tend to be equal. Accordingly, "c" and "e" were equal in "log scale", both showing about 60% gains. Similarly, "g" was equal to "a", both showing about 115% gain.

The Diametric development from '2003 to '2008 is considered to be the 1st wave of the Impuse. Due to the corrective structure in the 1st leg, the higher-degree 5th could be developing as a Terminal. Since '2008, we are into its 2nd wave, which could continue to develop over a period of 7-8 years beginning '2008.


As per NEoWave, break of 2-4 line confirms a Terminal development, and If the 5th proves to be a Terminal, the Super-Cycle-degree label of 3rd will have to change to 5th, because only a 5th of a 3rd cannot be a Terminal. Only a 5th of the 5th can be a Terminal. The Super-Cycle-Degree marking for 1st and 2nd as shown on ASA long-term chart, would then change to 3rd and 4th respectively.


Disclaimer
:
These notes/comments have been prepared solely to educate those who are interested in the useful application of Technical Analysis. While due care has been taken in preparing these notes/comments, no responsibility can be or is assumed for any consequences resulting out of acting on them.

--
--
​ 

--
You received this message because you are subscribed to the Google Groups "LONGTERMINVESTORSRESEARCH" group.
To unsubscribe from this group and stop receiving emails from it, send an email to longterminvestorsresearch+unsubscribe@googlegroups.com.
Visit this group at https://groups.google.com/group/longterminvestorsresearch.
For more options, visit https://groups.google.com/d/optout.

No comments:

Post a Comment